Measuring an AI-Development Workflow

In Part One of my retrospective, I introduced TruthByte and walked through my approach to an AI-first development workflow. I treated AI tools like instruments in a workshop—not autopilots, but accelerants. But after the hackathon, I wanted to know: was it as smooth and productive as it felt?
I didn’t want to stop at vibes. So I exported a month of Cursor history using SpecStory, an extension for the IDE. Once I had the chat logs, I thought: why not measure our qualities and display it like Jojo's Bizarre Adventure does for Stands? I hacked together a Python sentiment analysis program and pulled out trends, emotional signals, and performance patterns. I'm an not an expert in sentiment analysis, and there is inherent bias in writing the analysis myself, so take this with a grain of salt, but...
The result? Charts, insights—and a data-driven look at what it’s really like to build with AI. At least, on the Cursor side. At this time, ChatGPT does not have an export feature for projects. Give me my chats, OpenAI. ༼ つ ◕_◕ ༽つ
“Once I had the chat logs, I thought: why not measure our qualities and display it like Jojo's Bizarre Adventure does for Stands?"

🌀 Emotional Tone: How It Felt
I wanted to compare myself with the AI on similar grounds. Radar charts look cool, and they convey the difference between two things quickly.
Some of my early work in this data analysis found my gut feeling to be strongly aligned the data.
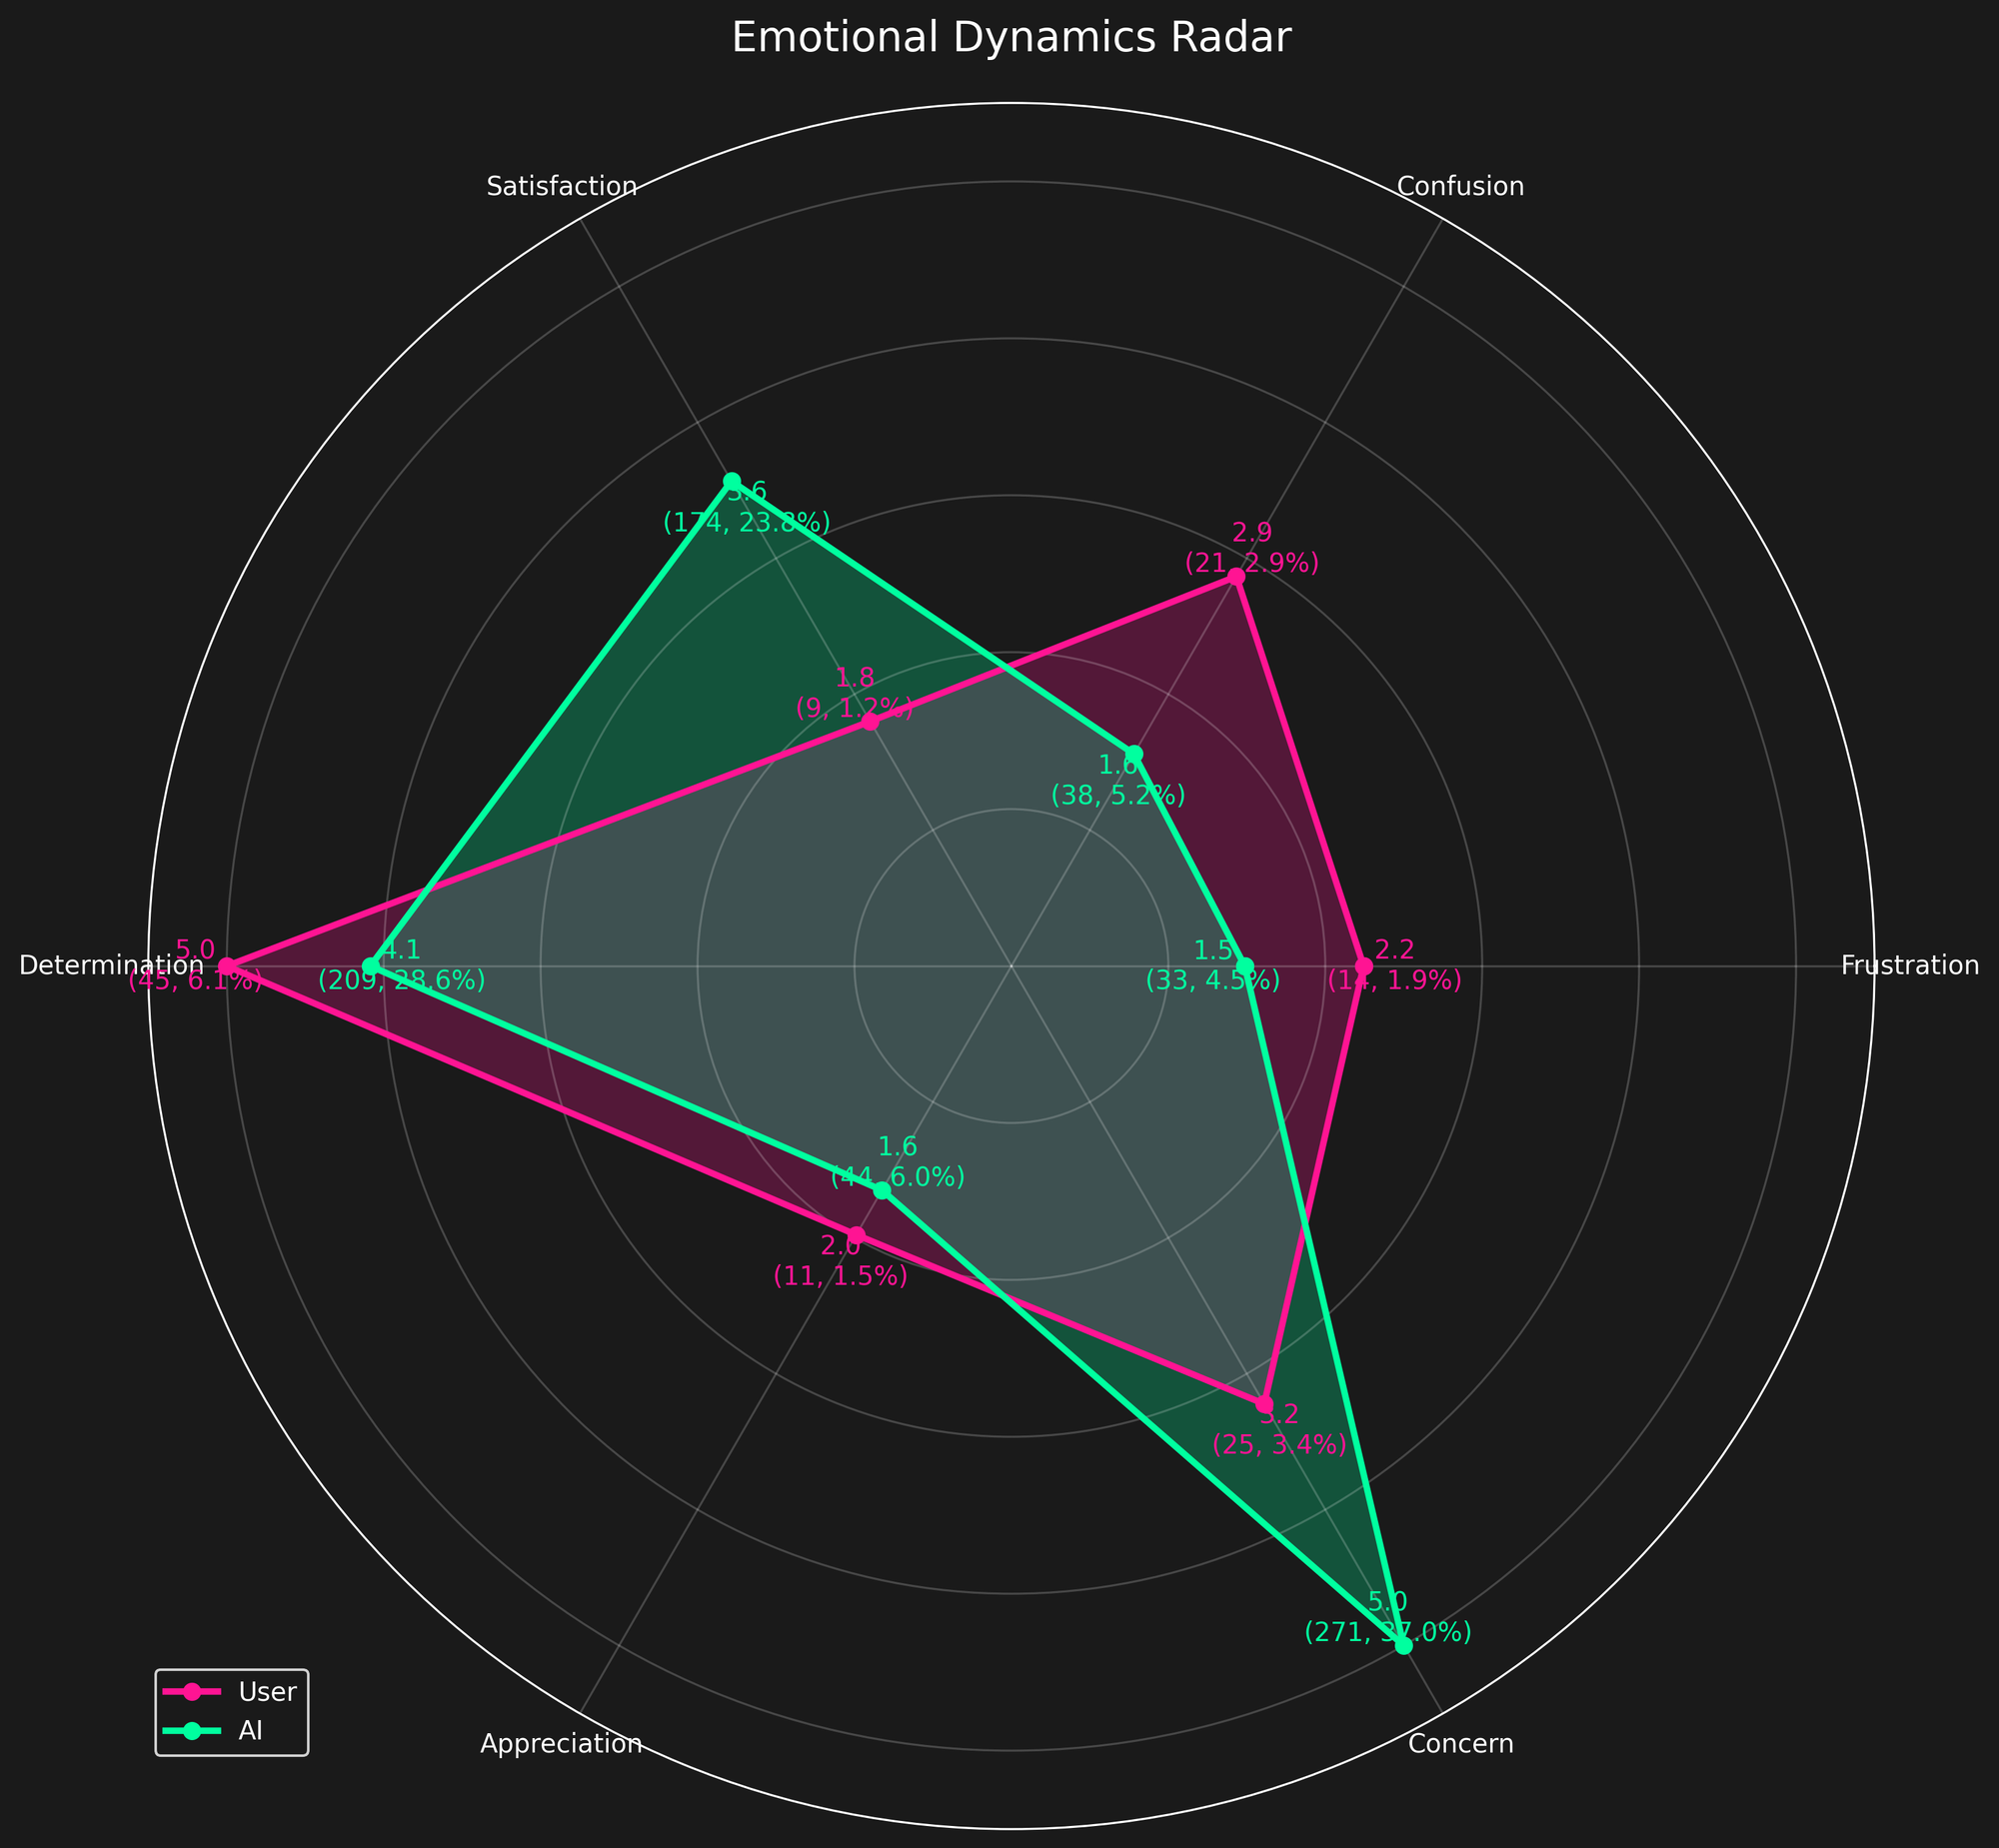
- My determination was the dominant human emotion, and AI had it as 2nd highest emotional score.
- My confusion was notable, though probably average for me doing rapid development work and debugging.
- AI's concern showed up consistently—likely an artifact of hedging language and “safe mode” suggestions.
- Frustration was low-moderate overall, which surprised me a bit—especially for a hackathon project.
- Appreciation markers were rare, at least in words. I wasn't high-fiving myself—or the AI—very often.
- The AI showed moderate satisfaction and was much more likely to celebrate our wins out loud.
The picture is pretty good: persistence, iteration, and small wins. If I care a lot and share my issues and concerns, the AI responds in kind.
🎮 Co-op Mode, Analyzed
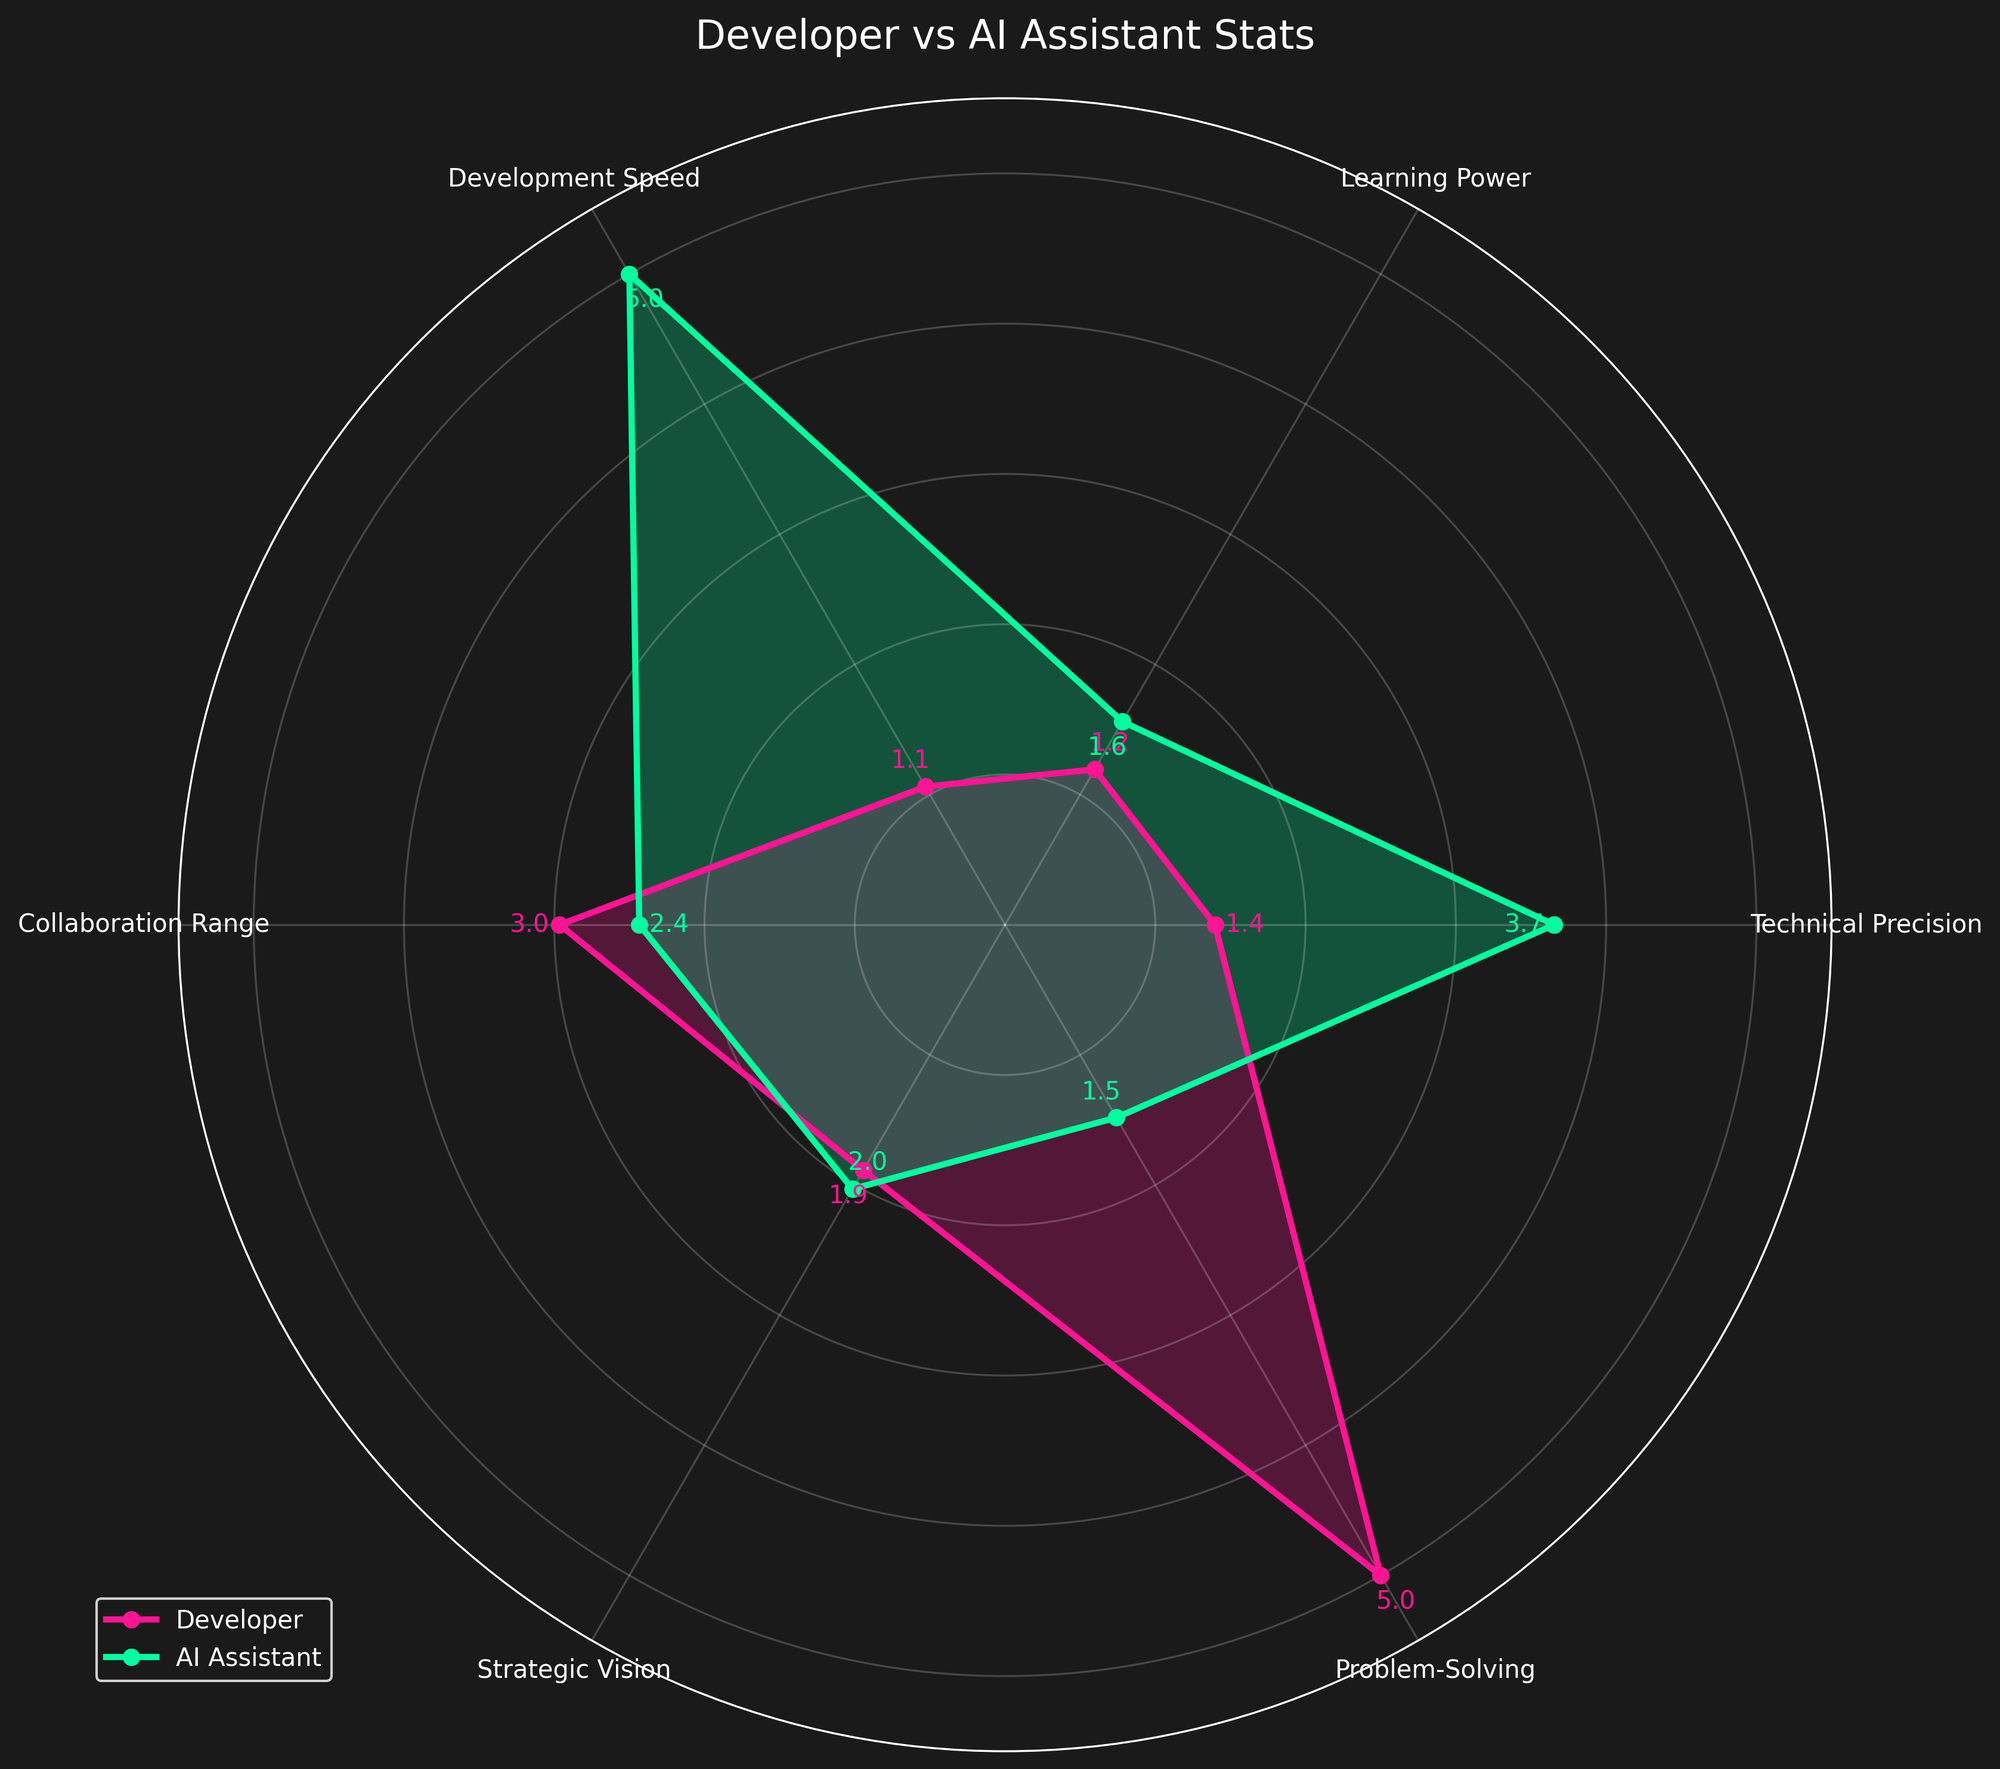
Early on, I gave myself and the AI six generalized metrics:
- Learning Power
- Technical Precision
- Development Speed
- Strategic Vision
- Collaboration Range
- Problem-Solving

I wish this was accurate. My original analysis reflected what I wanted to believe—me the strategist, the AI the executor.
And some of that was true.
But as I refined my data, I realized how much bias was baked into the scoring. I nudged the numbers toward narrative instead of observation.
I am hopeful we converge on reasonable metrics to track. Picking the wrong metrics or the wrong calculation for a metric will do harm. I think for personal self-reflection, analysis is helpful for learning and growing. After a week of fumbling around, I can say I am probably not the one to do this sort of analysis. It's hard!
📊 Phase Shifts
One thing I felt that I could quantify was determining which phase of development we were in over time. We had 1464 messages in total between us, and we had 999 phases detected.
📈 Phase Distribution
Total valid phases detected: 999
| Phase | Count | Percentage |
|---|---|---|
| Debugging | 353 | 35.3% |
| Implementation | 263 | 26.3% |
| Setup | 116 | 11.6% |
| Planning | 86 | 8.6% |
| Deployment | 82 | 8.2% |
| Documentation | 52 | 5.2% |
| Testing | 31 | 3.1% |
| Refactoring | 16 | 1.6% |
🔄 Phase Transitions
Common transitions between development phases:
| From | To | Count |
|---|---|---|
| Debugging | Implementation | 79 |
| Implementation | Debugging | 74 |
| Setup | Debugging | 34 |
| Setup | Implementation | 32 |
| Implementation | Setup | 31 |
| Debugging | Setup | 26 |
| Planning | Debugging | 21 |
| Debugging | Planning | 20 |
| Debugging | Deployment | 17 |
| Deployment | Debugging | 17 |
I took this information and made this phase transition diagram with heatmap arrows to highlight frequency. Jumping between debugging and implementation was the most common for certain, and I was glad to see that reflected in this chart.

📈 A Case for Self-Auditing
Using AI to build is a new skill. Using the chat history log data to reflect on how you build?
That could be a game changer.
This analysis helped me:
- Understand my own emotional and cognitive patterns
- Spot when I leaned too hard on AI (or didn't lean enough)
- Validate my instincts with data
- Reinforce my mantra: Slow is smooth, and smooth is fast
Even with only a surface-level grasp of sentiment analysis, I found signal. Not perfect, not publishable, but useful.
📓 My Analysis Tools
- SpecStory to export chats from Cursor
- A custom Python analyzer for sentiment, phase, and pattern analysis
- Matplotlib for visuals, plus a JoJo-style radar generator
- A whole lot of regex
I don’t plan to open-source the code just yet—it’s still messy and experimental. But if you’re doing anything like this, I’d love to compare notes.
🔗 Curious for more?
👋 What’s Next?
I’m still developing my AI skillset. I plan to explore agents, build models, and maybe even try my hand at an MCP someday.
And who knows—six months from now, I might have a totally different view of all this.
But for now? If you’re building with AI and want to swap radar charts, find me on Twitter/X or drop me a note at [email protected].
Let’s push this forward—together.